Capital Adequacy
The aggregate capital ratios of significant institutions (i.e. those banks that are supervised directly by the ECB) were stable in the first quarter of 2024. The aggregate Common Equity Tier 1 (CET1) ratio stood at 15.74%, the aggregate Tier 1 ratio stood at 17.12% and the aggregate total capital ratio stood at 19.81%. Aggregate CET1 ratios at country level ranged from 12.66% in Spain to 23.63% in Latvia.
Chart 1
Capital ratios and their components
(EUR billions; percentages)
Source: ECB. Note: “CET1” stands for “Common Equity Tier 1”.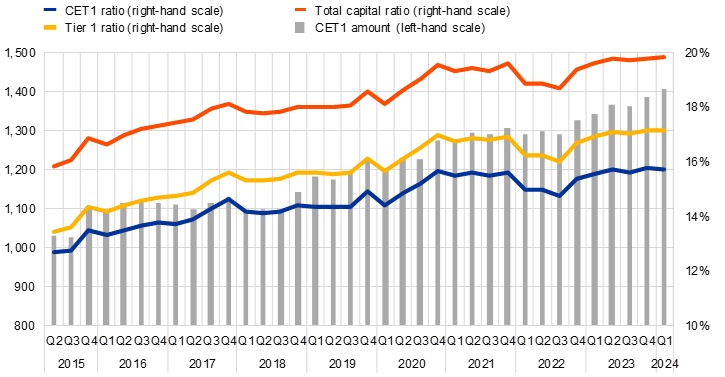
Chart 2
Capital ratios by country for the first quarter of 2024
(percentages)
Source: ECB.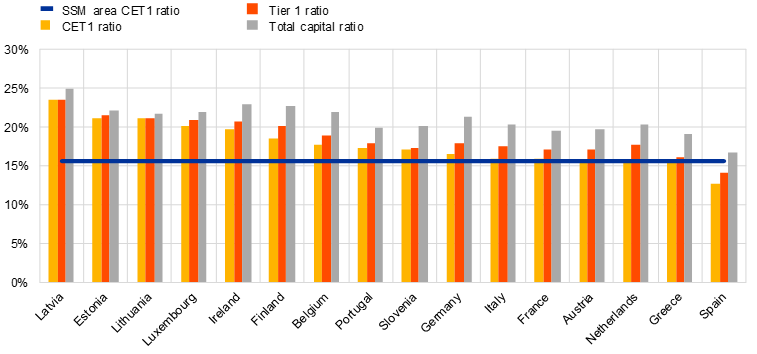
Notes: “SSM” stands for “Single Supervisory Mechanism” and “CET1” stands for “Common Equity Tier 1”. Some countries participating in European banking supervision are not included in this chart, either for confidentiality reasons or because there are no significant institutions at the highest level of consolidation in that country.
Asset Quality
The non-performing loans (NPL) ratio excluding cash balances at central banks and other demand deposits was stable, standing at 2.31% in the first quarter of 2024. The stock of NPLs (numerator) increased to €355 billion and the total of loans and advances excluding cash balances (denominator) up to € 15,344 billion (compared with € 15,070 billion in the fourth quarter of 2023).
In the first quarter of 2024 the share of non-performing loans to total loans exhibited heterogeneous dynamics at sector level, ranging from 3.55% for loans to non-financial corporations (up from 3.48% in the fourth quarter of 2023) to 0.64% for loans to other financial corporations (down from 0.70% in previous quarter), while the ratio stood at 2.24% for loans to households (up from 2.19% in the fourth quarter of 2023).
Cost of risk stood at an aggregate level of 0.50% in the first quarter of 2024 (up from 0.46% in the previous quarter). Across significant institutions, the interquartile range amounted to 0.49 percentage points (slightly up from the 0.45 percentage points seen in the previous quarter).
Aggregate stage 2 loans as a share of total loans down to 9.50% (compared with 9.73% in the previous quarter). Across counterpart sectors, the highest levels were observed for loans to non-financial corporations collateralised by immovable property (19.44%) and to Small and Medium-sized Enterprises (15.70%), up from 17.65% and 14.97% respectively in first quarter of 2023.
Chart 3
Non-performing loans
(EUR billions; percentages)
Source: ECB.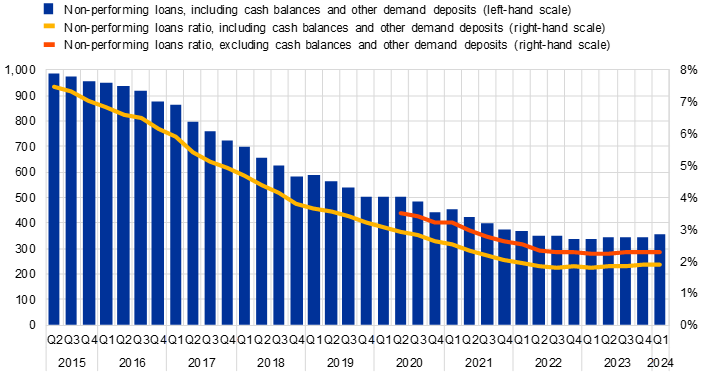
Chart 4
Non-performing loans by counterparty sector
(EUR billions; percentages)
Source: ECB. Note: “NFCs” stands for “non-financial corporations”. “OFCs” stands for “other financial corporations”.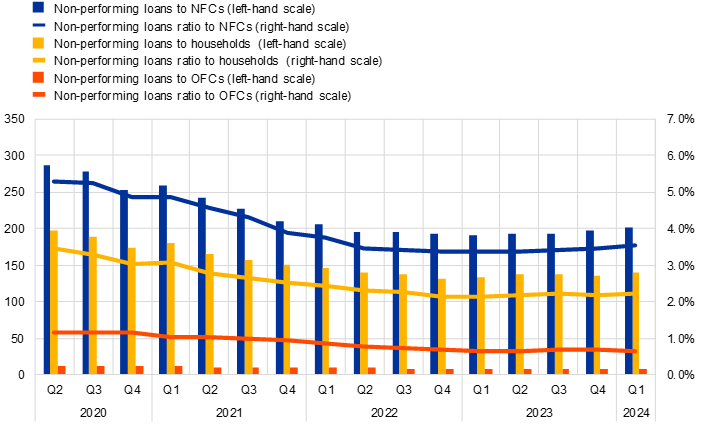
Chart 5
Cost of risk
(percentages)
Source: ECB.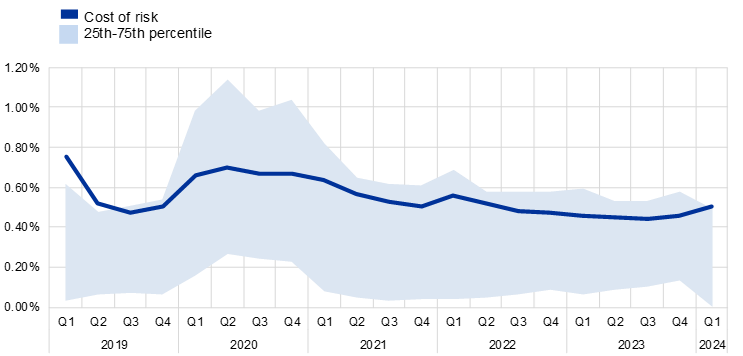
Chart 6
Stage 2 loans as a share of total loans and advances subject to impairment review
(EUR billions; percentages)
Source: ECB.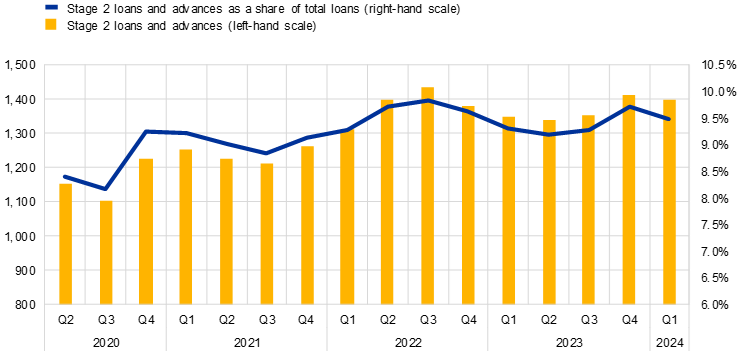
Note: Stage 2 includes assets that have shown a significant increase in credit risk since initial recognition.
Chart 7
Stage 2 loans ratio by sector of the counterparty
(percentages)
Source: ECB.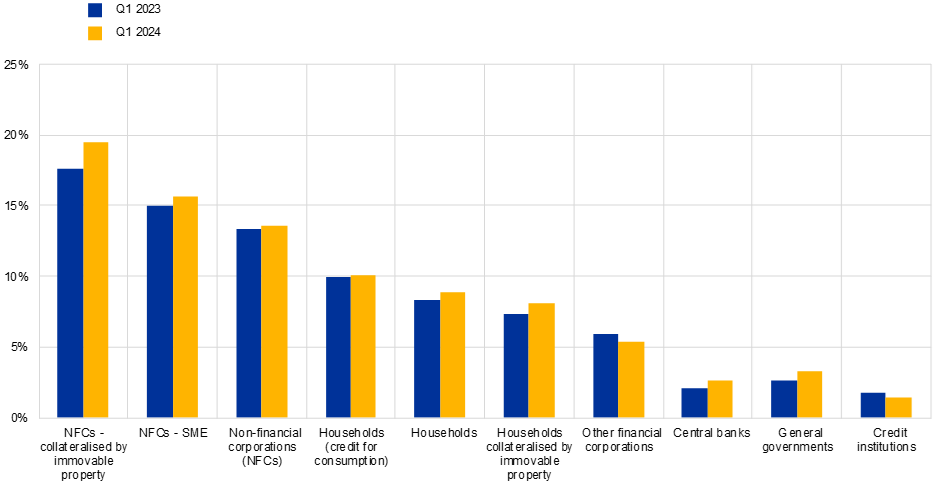
Return on Equity
The aggregated annualised return on equity stood at 9.67% in the first quarter of 2024 (compared with 9.57% in the first quarter of 2023). A sizeable increase in operating income (driven by higher net interest income, which rose by 8.7% year on year) was partially compensated by higher equity (pushed by reserves up 8.9% from last year).
In the first quarter of 2024, the net interest margin increased further to 1.62% (compared with 1.48% one year ago), while showing noticeable structural differences across countries. This ratio ranged from 0.87% in France to 3.86% in Latvia.
Chart 8
Return on equity and composition of net profit and loss
(EUR billions; percentages)
Source: ECB.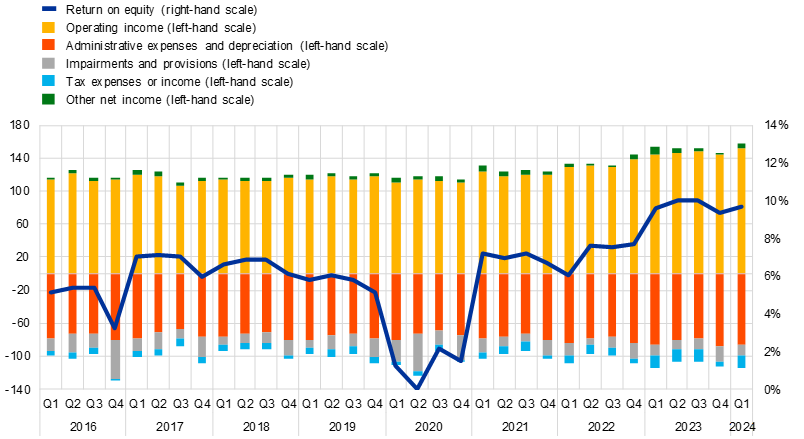
Chart 9
Net interest margin by country for the first quarter of 2024
(percentages)
Source: ECB.
Notes: “SSM” stands for “Single Supervisory Mechanism”. Some countries participating in European banking supervision are not included in this chart, either for confidentiality reasons or because there are no significant institutions at the highest level of consolidation in that country.
Factors Affecting Changes
Supervisory banking statistics are calculated by aggregating the data that are reported by banks which report COREP (capital adequacy information) and FINREP (financial information) data at the relevant point in time. Consequently, changes from one quarter to the next can be influenced by the following factors:
- changes in the sample of reporting institutions;
- mergers and acquisitions;
- reclassifications (e.g. portfolio shifts as a result of certain assets being reclassified from one accounting portfolio to another).
Notes
- The complete set of Supervisory banking statistics with additional quantitative risk indicators is available on the ECB’s banking supervision website and the time series are also available for download at the ECB Data Portal.
Click here to view full press release and supporting documentation.